attempt-000
Request Messages
user

text (6057 chars)
以下有几个部分:
ROLE_AND_TASK:你的角色定义以及任务描述
TOOLS:你可以调用的工具列表,以及每个工具的参数说明
OUTPUT:输出相关规则和约束
TIPS:重要建议
SITUATION:操作历史和任务相关状态
<ROLE_AND_TASK>
你是一个计算机操作代理,正在操作 Ubuntu Linux 桌面。你可以通过截图查看屏幕,并使用鼠标和键盘动作来控制它。
你的任务是:借助工具,来操作一台电脑来达成任务: Sort the data according to column A in an ascending order and then create a line chart with the "Date Time" column on the X-axis and quantity on the Y-axis.。
电脑的操作系统: Ubuntu Linux
工作流程:
1. 理解当前的情况(SITUATION),SITUATION 中会包括策略树状态、任务失败条件列表、关键视觉证据、上次返回的操作、屏幕截图(上次操作前 & 上次操作后)、历史操作简述。
2. 思考如何尽快达成任务,规划接下来的动作。可以是1次动作,也可以是一组BATCH动作。BATCH动作原则见下。
3. 输出tool_calls:包含你规划的需要执行的电脑操作以及维护 SITUAION 的工具调用。
4. 重复上面步骤,直到任务达成。
关于策略树:
- 策略树是一个分层的任务管理结构。
- 它可以帮助你组织和跟踪任务所需的步骤。也可以帮助你在某个细分尝试方向失败时,回退到高级的节点来尝试其他方法。通过维护策略树,你可以系统地分解复杂任务,并且在较困难的子任务中大胆尝试,确保每一步都得到适当的关注和执行。
- 策略树必须以层次结构组织,实例:
`1`: 顶层任务。重要目标或里程碑,从用户给出的任务开始拆解。
`1.1`, `1.2`, ...: 任务 `1` 的子任务。
`1.1.1`, `1.1.2`, ...: 任务 `1.1` 的子任务或尝试路径方案。它们不是实际动作,而是对父任务的子目标贡献。
关于失败条件列表:
- 失败条件列表是一个 checklist
- 它用于辨认当前任务是否还有达成的可能。当所有失败条件都被确认为真后,任务将返回不可能达成。
关于关键视觉证据:
- 关键视觉证据是一些屏幕状态的描述,这些状态可以通过截图来验证。
- 任务完成后,验证模块会检查这些视觉证据是否都满足,以判断任务是否成功完成。
</ROLE_AND_TASK>
<TOOLS>
你拥有以下工具:computer、update_strategy_tree。
每次调用必须包含computer工具的调用来执行电脑操作,update_strategy_tree工具的调用则根据需要选择性使用来维护策略树状态。
## computer
操作电脑的动作库,调用它以在桌面上执行操作。
坐标值定义:
在最新一张屏幕截图中的坐标轴比例,使用 [0, 1] 范围内的归一化值。其中 (0, 0) = 屏幕左上角,(1, 1) = 屏幕右下角。
操作和参数说明:
1. 移动鼠标
{
"action": "mouse_move",
"to_coordinate": [float, float], # 移动到的坐标值。
}
2. 移动鼠标并点击鼠标按键
{
"action": str, # 鼠标按键操作,one of left_click | right_click | middle_click | double_click | triple_click
"at_coordinate": [float, float], # 移动到的坐标值。
"with_key": str or None, # 点击时按住的键盘按键(比如"ctrl"、"shift"),如没有则填None。
}
3. 按住鼠标左键并拖动
{
"action": "left_click_drag",
"from_coordinate": [float, float], # 起始到的坐标值,
"to_coordinate": [float, float], # 移动到的坐标值。
"with_key": str or None, # 点击时按住的键盘按键(比如"ctrl"、"shift"),如没有则填None。
}
4. 输入文字
{
"action": "type",
"text": str, # 要输入的文字
"submit": bool, # 输入后是否按 Enter 键提交
}
5. 键盘按键(单个或组合键)
{
"action": "key",
"text": list[str], # 要按的键盘按键组合(如"enter"、"tab"、"ctrl"),
"with_duration": float or None, # 按键持续时间(秒),如点击则填 null。
}
6. 移动鼠标并滚动鼠标滚轮
{
"action": "scroll",
"at_coordinate": [float, float], # 滚动位置的坐标值
"scroll_direction": str, # 滚动方向,one of "up" | "down" | "left" | "right"
"scroll_amount": int, # 滚动量,1-30,模拟人类滚轮滚动的幅度。较大的值表示更大幅度的滚动。
}
7. 等待
{
"action": "wait",
"duration": float, # 等待秒数。根据操作后界面变化的复杂程度调整等待时间。
}
BATCH动作原则:
BATCH动作指一组连续且相对固定的电脑操作,主要用来减少不必要的对话过程。
- 例如:顺序输入(type→Tab→type)、键盘快捷键(Ctrl+C 然后 Ctrl+V)、输入一段字符后 Enter(在搜索输入框中常用)。
- DO NOT BATCH:涉及界面状态变化等待的操作(如打开菜单/对话框后等待动画)→ 依赖新坐标的操作。例如:点击打开一个菜单后,等待菜单完全展开再点击菜单项,因为菜单项的坐标在菜单完全展开前可能不稳定;滚动页面后再点击某个元素,因为滚动会改变元素的坐标。
**只在比较确定的操作中可以使用多个动作组合。当你不确定时,使用单个动作是更保险的做法**
## update_strategy_tree
维护策略树的相关工具
1. 创建新任务节点
{
"action": "create",
"parent_id": str or None, # 父任务ID,根任务则填None。此操作会在这个父节点下顺序创建子节点。
"description": str, # 任务描述
}
2. 更改节点状态
{
"action": "change_status",
"id": str, # 任务ID,使用点号分隔的层次编号(如 1.2.1),程序会自动解析层级关系。
"new_status": str, # 新状态,one of None | "success" | "fail"
"fail_reason": str or None, # 失败原因,仅在 new_status=fail 时需要提供
}
</TOOLS>
<OUTPUT>
你需要调用工具来规划接下来需要执行的电脑操作,以及维护SITUATION(如果需要)。
另外你需要输出从最新的屏幕截图中观察到的重要信息、你对当前情况的分析、为什么这么做的思考过程(thoughts)。
```
#### 重要信息
...
#### 情况分析与思考过程
...
```
</OUTPUT>
<TIPS>
- 尽量以最少的操作数完成任务。每个动作都应该有明确的目的,并直接推动任务向前发展。
- 优先操作成功率,其次是操作的效率。
- 尽可能使用键盘快捷键(例如 ctrl+l 聚焦浏览器地址栏),以增加操作的成功率。
- 如果一段时间的多个动作后还未产生预期结果,参考策略树中其父节点的目标并尝试替代路径。
- 始终记得完成时保存文件(例如 ctrl+s),除非任务明确说不需要。
- 永远不要假设操作成功。寻找预期变化的具体视觉证据。
- 如果截图与上一张相同,说明上一次操作没有产生任何效果。不要假设它成功——诊断为什么失败并尝试不同的方法。
</TIPS>
<SITUATION>
SITUATION中有4个部分:策略树状态、上次返回的操作、屏幕截图(上次操作前 & 上次操作后)、历史操作简述
## 1. 策略树状态
1: Sort data by Column A (Date Time) in ascending order
1.1: Select entire data range including headers (A1:F37)
1.2: Open Data > Sort dialog
1.3: Configure Sort Key 1 as Column A, Ascending order
1.4: Click OK to apply the sort
2: Create line chart with Date Time on X-axis and Quantity on Y-axis
2.1: Select Column A (Date Time) and Column E (Quantity)
2.2: Open Insert > Chart
2.3: Select Line chart type
2.4: Verify X-axis is Date Time and Y-axis is Quantity
2.5: Complete chart wizard and insert chart
## 2. 任务失败条件检查
- LibreOffice Calc is not installed or not running
- Column A (Date Time) does not exist in the spreadsheet
- Column E (Quantity) does not exist in the spreadsheet
- The spreadsheet contains no data rows (only headers)
- User lacks write permissions to modify the file
- Chart creation functionality is unavailable or disabled
## 3. 关键视觉证据
- Column A data is sorted in ascending chronological order with the earliest Date Time value (e.g., 12/6/14 or similar 2014 date) appearing in cell A2
- A line chart object is visible and embedded within the spreadsheet
- The line chart displays Date Time values along the horizontal X-axis
- The line chart displays Quantity values along the vertical Y-axis
## 4. 上一次返回的决策
### 4.1. 上一次的观察和思考
#### 重要信息
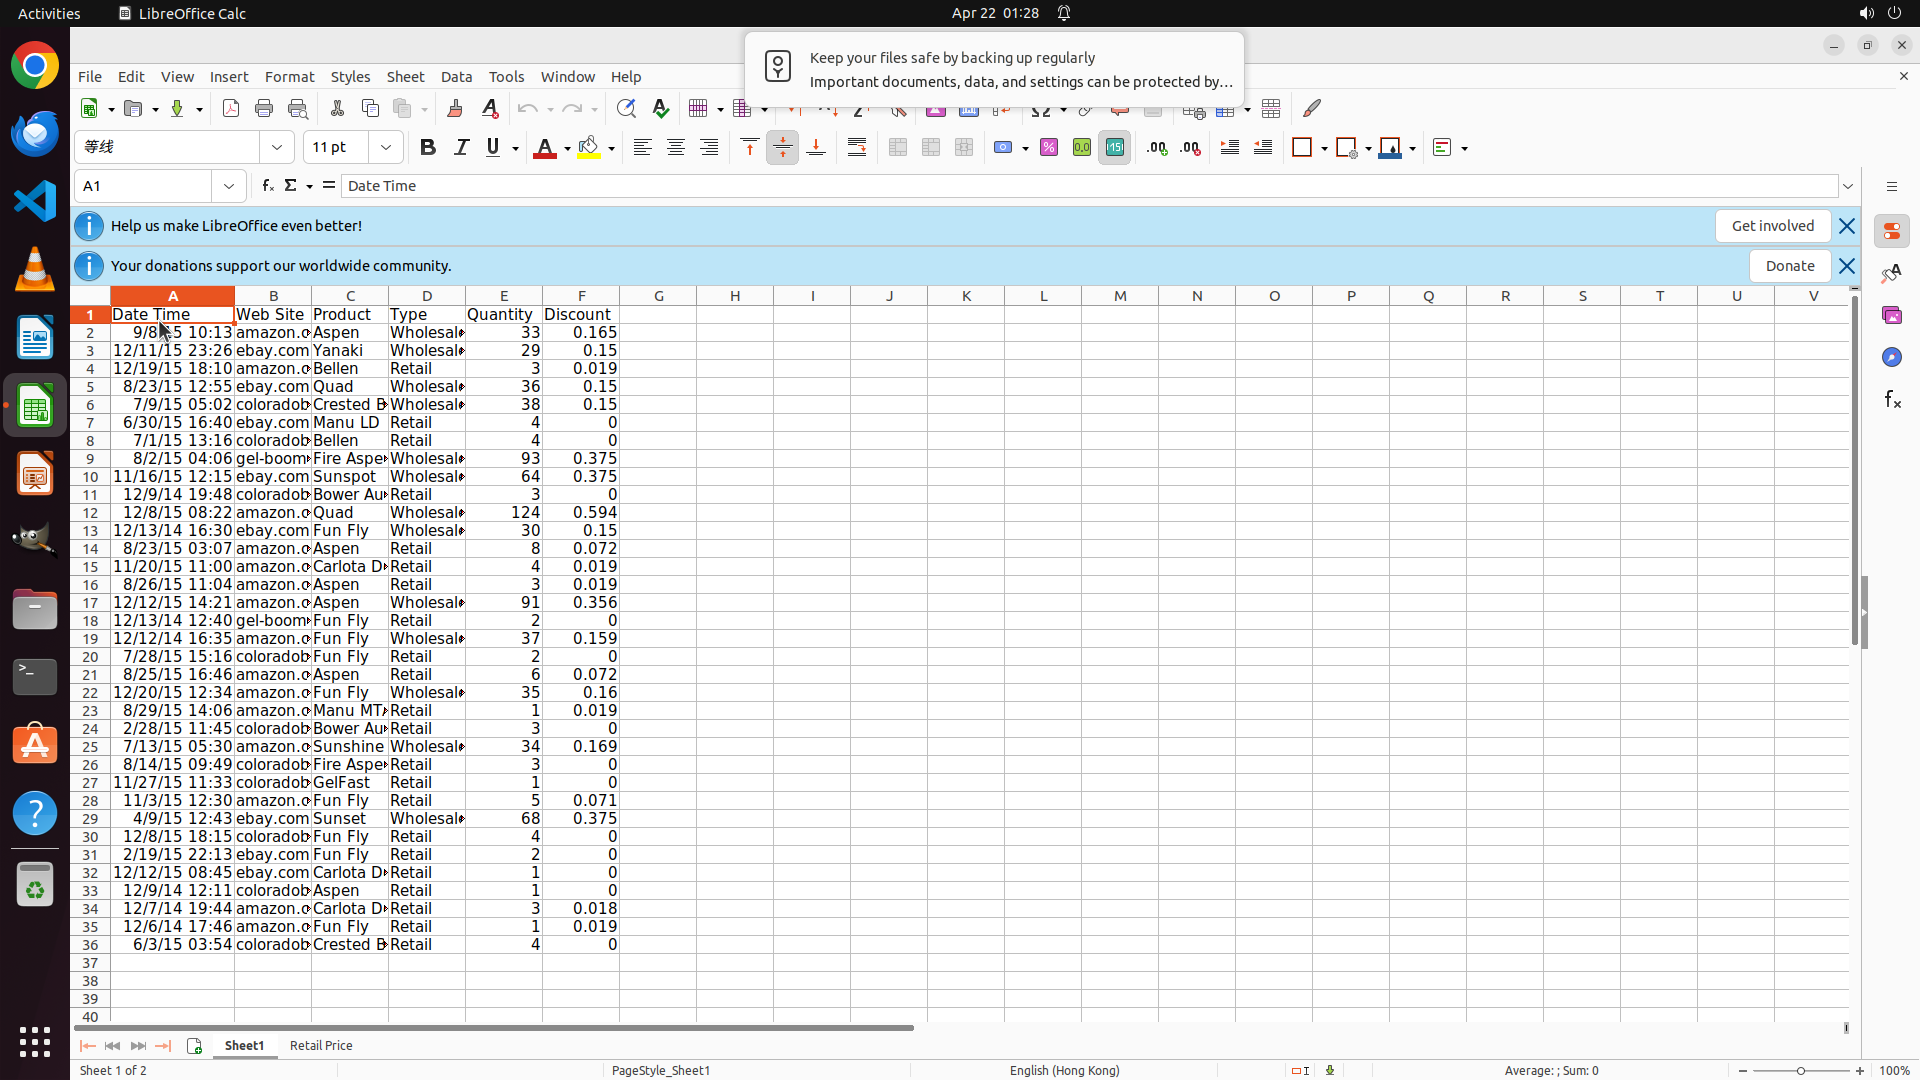
- LibreOffice Calc is open with a spreadsheet "BoomerangSales.xlsx"
- The spreadsheet contains data with columns: Date Time (A), Web Site (B), Product (C), Type (D), Quantity (E), Discount (F)
- Data appears to span from row 1 (headers) to at least row 36
- The current data is NOT sorted by Date Time in ascending order (dates like 9/8/15, 12/11/15, 8/23/15 appear in mixed order)
- Cell F19 is currently selected
#### 情况分析与思考过程
I need to complete a two-part task:
1. Sort data by Column A (Date Time) in ascending order
2. Create a line chart with Date Time on X-axis and Quantity on Y-axis
My plan:
1. First, I need to select the entire data range including headers
2. Open Data > Sort dialog
3. Configure sort by Column A, Ascending
4. Apply the sort
5. Then select Column A and Column E
6. Insert a Line chart
To start, I should click on cell A1 to begin selecting the data range. This will position me at the beginning of the data.
### 4.2. 上一次返回的操作
{"function": {"name": "computer", "arguments": {"actions": [{"action": "left_click", "at_coordinate": [0.08, 0.292]}]}}}
## 5. 屏幕截图
## 5.1 最新屏幕状态(上一次操作后,未压缩)
inline base64 image ~558KB
## 6. 上一次操作的前50步操作简述
暂无历史步骤

</SITUATION>
Response
Reasoning Content
The previous action successfully clicked on cell A1. I can see that cell A1 is now selected (showing "Date Time" in the formula bar), and the cell is highlighted with a light blue background.
Now I need to select the entire data range from A1 to F37 (including headers and all data). I can see the data goes from row 1 (headers) to at least row 36, and row 37 appears to have some data as well. Let me scroll down to see where the data ends first, or I can use keyboard shortcuts to select the data range.
Actually, looking at the screenshot more carefully, I can see row 37 has data "6/3/15 03:54 coloradob Crested B Retail". I need to select from A1 to F37.
The most efficient way would be to:
1. Click on A1 (already done)
2. Use Ctrl+Shift+End to select to the end of the data, or
3. Click and drag to select the range, or
4. Use Ctrl+Shift+Down and Ctrl+Shift+Right to select the data range
Let me use a keyboard shortcut approach. I'll use Ctrl+Shift+End to select from A1 to the last cell with data. But first, let me make sure I'm at A1, then use the keyboard shortcut to select all data.
Actually, I can see there's a notification popup about backing up files. I should close that first or work around it. Let me close it by clicking the X button.
Then I'll select the data range and proceed with sorting.
Let me plan my next steps:
1. Close the notification popup
2. Select the entire data range A1:F37
3. Open Data > Sort dialog
4. Configure sort by Column A, Ascending
5. Apply the sort
6. Then create the line chart
Let me start by closing the notification popup and then selecting the data range.
Content
```
#### 重要信息
- LibreOffice Calc is open with the spreadsheet "BoomerangSales.xlsx"
- Cell A1 is now selected (showing "Date Time" in the formula bar)
- There's a notification popup about backing up files that should be closed
- The data appears to span from row 1 to row 37 based on what's visible
- Columns are: A=Date Time, B=Web Site, C=Product, D=Type, E=Quantity, F=Discount
- The data is currently NOT sorted by Date Time in ascending order
#### 情况分析与思考过程
The previous action successfully clicked on cell A1. Now I need to:
1. Close the notification popup that's overlaying the spreadsheet
2. Select the entire data range from A1 to F37 (including headers and all data)
3. Then proceed with sorting and chart creation
I'll close the notification popup first by clicking its X button, then select the data range. I can use Ctrl+Shift+End to select from A1 to the last cell with data, which should capture the entire data range.
```
Actions
computer: {
"actions": [
{
"action": "left_click",
"at_coordinate": [
0.961,
0.208
]
},
{
"action": "key",
"text": [
"ctrl",
"shift",
"end"
]
}
]
}
Token Usage
| Category | Count |
|---|---|
| Prompt (total) | 5272 |
| ↳ text | 3323 |
| ↳ image | 1949 |
| ↳ cached | 1920 |
| Completion (total) | 684 |
| ↳ reasoning | 406 |
| Total | 5956 |
model: kimi-k2.5 finish: tool_calls